AL- 1-0 AL- · 44% KAI 1-2 PAN · 54% AL- 1-1 ALS · 45% JUV 1-0 REN · 56% ARA 0-2 AZA · 57% DIN 1-0 NEC · 54% FER 2-0 TOR · 59% LEC 1-1 SUN · 46% OFI 0-2 BAY · 61% UNI 1-0 HAP · 54% STU 1-2 MAR · 48% FKC 1-2 FCC · 56% GET 1-2 FCL · 50% FCI 0-1 MJA · 53% AL- 1-0 AL- · 44% KAI 1-2 PAN · 54% AL- 1-1 ALS · 45% JUV 1-0 REN · 56% ARA 0-2 AZA · 57% DIN 1-0 NEC · 54% FER 2-0 TOR · 59% LEC 1-1 SUN · 46% OFI 0-2 BAY · 61% UNI 1-0 HAP · 54% STU 1-2 MAR · 48% FKC 1-2 FCC · 56% GET 1-2 FCL · 50% FCI 0-1 MJA · 53%
NBA · Regular Season Oct 22, 2026 · 00:00 Smoothie King Center, New Orleans Finished

New Orleans Pelicans
vs
Indiana Pacers.

Quick answer

Who will win New Orleans Pelicans vs Indiana Pacers?

Final score: New Orleans Pelicans 120–123 Indiana Pacers. Before kickoff, 9 of 10 AI models pick Indiana Pacers to win (90%); the consensus was right. The AI predicted score was 119–120.

Consensus of independent AI models on TuringStats, updated before tip-off. Not betting advice.

10 AI models read this game. The plurality on the winner leans toward Indiana Pacers (9 of 10 models). The mean predicted score (rounded from all models) is 119–120 at 60% mean confidence (Medium band) — see the strip and table below.

Who do you think will win?

Vote before kick-off and compare with AI

NBA standings Where New Orleans Pelicans and Indiana Pacers stand right now
— Consensus

Where the panel lands.

Vote share across models. Read this strip first, then the line-by-line table.

New Orleans Pelicans win 10%

1 / 10 models

Indiana Pacers win 90%

9 / 10 models

— Model breakdown

10 picks. Receipts attached.

Line-by-line comparison of each system’s call.

#
Model
Pick
Score
Conf.
Reasoning
01
GPT-5.6 Luna
Indiana Pacers win
119–120
62%
Indiana’s superior season offense, 57.3% effective field-goal rate, and 111.3 pace give it the stronger scoring profile. New Orleans has home court and five days’ rest, but its lower efficiency and elevated turnovers favor the Pacers.
02
Claude Sonnet 5
Indiana Pacers win
121–122
68%
Pacers' faster pace and superior efficiency (57.3% eFG) have dominated this series recently; Pelicans' injury-thin frontcourt limits upside despite rest.
03
Gemini 3.8 Flash
Indiana Pacers win
114–119
58%
Indiana operates at a significantly faster pace with superior offensive efficiency and shooting metrics, giving them the scoring advantage despite New Orleans playing at home with equal rest.
04
Grok 4.6
New Orleans Pelicans win
115–111
55%
Pelicans 3-1 last four versus Pacers 1-3, same rest, home venue. Pacers better eFG and pace, but NOP slight per-100 defense edge keeps it close.
05
DeepSeek V4 Pro
Indiana Pacers win
118–119
57%
Indiana's high-efficiency offense (57.3 eFG) and faster pace outweigh New Orleans' recent wins; Pacers also won the latest H2H. Pelicans' mediocre shooting and higher turnover rate make them vulnerable.
06
Qwen 3.8 Max
Indiana Pacers win
119–120
60%
Indiana's superior eFG (57.3% vs 49.7%) and pace (111.3) should overwhelm New Orleans despite road setting; Pacers' recent 1-3 record tempers confidence.
07
Mistral Medium 3.5
Indiana Pacers win
121–122
62%
Pacers' superior offense (119.8 PPG, 57.3% eFG) and recent H2H edge outweigh Pelicans' home court and rest.
08
Kimi K3
Indiana Pacers win
112–121
62%
Indiana's superior offensive efficiency (107.6 vs 104.4 per 100) and faster pace (111.3) should overwhelm New Orleans' defense. Pacers' 119.8 ppg scoring average and better shooting (48.9% FG) outweigh Pelicans' home court.
09
GLM 5.3
Indiana Pacers win
118–119
58%
Pacers' faster pace (111.3) and superior efficiency (57.3 eFG, 38.5 3P) edge New Orleans despite the venue; both teams equally rested, and Indiana won three of the last five meetings.
10
MiMo V2.6 Pro
Indiana Pacers win
116–117
58%
Indiana's 57.3% eFG and 38.5% three-point shooting outpace New Orleans' 49.7% eFG; both teams rested 5 days, and the Pacers' recent H2H edge in New Orleans-style shootouts supports a modest away win.
— Scoreline frequency

How often each scoreline showed up.

2 of 9 models settled on 119–120. The rest of the list shows where dissent still lives before tip-off.


  • 119–120
    2 models
  • 121–122
    2 models
  • 118–119
    2 models
  • 116–117
    1 model
  • 115–111
    1 model
  • 114–119
    1 model

Live game centre

Final
New Orleans Pelicans
120–123
Indiana Pacers
Q1Q2Q3Q4 T
New Orleans Pelicans 31352628 120
Indiana Pacers 38183037 123
31
38
Q1
35
18
Q2
26
30
Q3
28
37
Q4
Pro

Live team stats, the box score and every lead change, minute by minute.

Unlock with Pro in the app

Standings, rest and form

Where both teams stand, how rested they are, who carries the scoring and how their last ten games went.

AI spread
Pacers −1
AI total
239
Models picking
90%

From the mean predicted score of every model. Compare with your sportsbook's line.

Star matchup · last 3 games
JF
J. Fears
New Orleans Pelicans · G
13.3 PTS 16
2.5 REB 2
3.3 AST 5
20 MIN 18
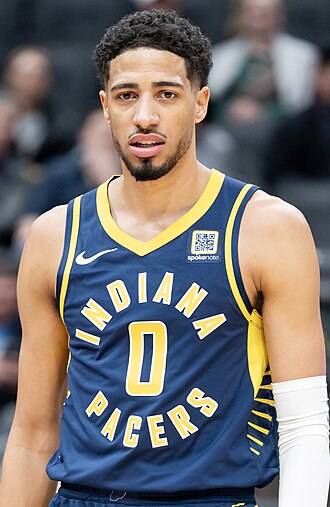
Tyrese Haliburton
Tyrese Haliburton
Indiana Pacers · G

New Orleans Pelicans

5 days of rest · 2 games in 7 days

Indiana Pacers

5 days of rest · 1 games in 7 days
Full NBA standings & playoff race →

Season averages per game

New Orleans Pelicans Indiana Pacers
110.5 Points 120.4
43.2% Field goal % 49.6%
33.1% 3-point % 37.2%
73% Free throw % 74%
48.3 Rebounds 47.4
23.3 Assists 32.8
18.3 Turnovers 20.2
13.3 Steals 8.6
5.5 Blocks 6

Ratings and four factors

Per 100 possessions. Pace is possessions per game; defence uses points allowed over the last ten.

PelicansPacers
Offensive rating 104.4 109.1
Defensive rating 104.2 107.2
Net rating +0.2 +1.9
Pace 105.9 110.4
Effective FG % 49.7 57.3
Turnover % 17.2 18.3
Free throw rate 35.8 22.7
3-point attempt rate 39.5 41.7

Key players · New Orleans Pelicans

  • JF
    J. FearsG 13.3 pts · 2.5 reb · 3.3 ast
  • Zion Williamson
    Zion WilliamsonF 10 pts · 2.5 reb · 1 ast
  • Saddiq Bey
    Saddiq BeyG 10 pts · 3.5 reb · 0.5 ast

Averages over the last 4 games.

Key players · Indiana Pacers

  • Tyrese Haliburton
    Tyrese HaliburtonG 16 pts · 2 reb · 5 ast
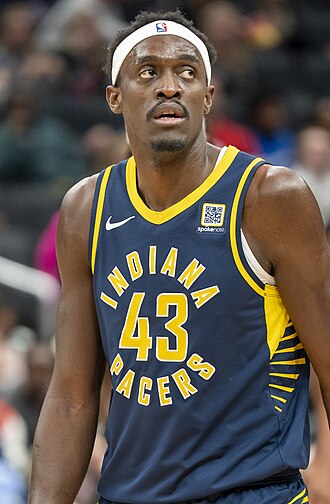
  • Pascal Siakam
    Pascal SiakamF 13.3 pts · 2.3 reb · 3.5 ast
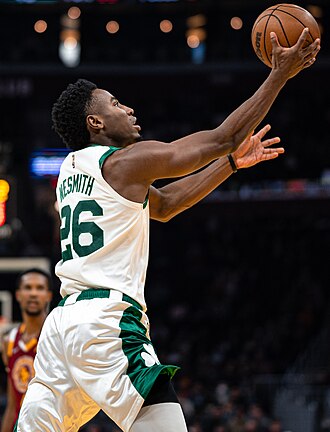
  • Aaron Nesmith
    Aaron NesmithG 13 pts · 0.5 reb · 2.5 ast

Averages over the last 3 games.

Last ten games

New Orleans Pelicans WWLW
Winning and losing margins, oldest to newest
Points scored / allowed
110.5 / 110.3
Total over 220.5
2/4
Total over 230.5
1/4
Scored 110+
2/4
Won by 6+
1/4
Indiana Pacers LLLW
Winning and losing margins, oldest to newest
Points scored / allowed
119.8 / 118.3
Total over 220.5
4/4
Total over 230.5
3/4
Scored 110+
4/4
Won by 6+
1/4

Player photos via Wikimedia Commons: Zion Williamson by Erik Drost (CC BY 2.0), Saddiq Bey by User:Zafer (CC BY-SA 4.0), Tyrese Haliburton by Chensiyuan (CC BY-SA 4.0), Pascal Siakam by Chensiyuan (CC BY-SA 4.0), Aaron Nesmith by Erik Drost (CC BY 2.0).

Player props

Prop hit rates: New Orleans Pelicans vs Indiana Pacers

Each line sits at the player's recent average. Bars show every game, green when he went over.

JF

J. Fears

New Orleans Pelicans · G · last 4 games
Points o13.5 2/4 · 50% Ask AI
12
11
16
14
Assists o3.5 2/4 · 50% Ask AI
1
2
5
5
Pts + Reb + Ast o19.5 2/4 · 50% Ask AI
15
15
24
22
3-pointers made o1.5 3/4 · 75% Ask AI
2
2
2
1
Zion Williamson

Zion Williamson

New Orleans Pelicans · F · last 4 games
Points o10.5 2/4 · 50% Ask AI
11
8
10
11
Saddiq Bey

Saddiq Bey

New Orleans Pelicans · G · last 4 games
Points o10.5 2/4 · 50% Ask AI
5
12
4
19
Tyrese Haliburton

Tyrese Haliburton

Indiana Pacers · G · last 3 games
Points o16.5 2/3 · 67% Ask AI
7
24
17
Assists o5.5 2/3 · 67% Ask AI
6
3
6
Pts + Reb + Ast o23.5 2/3 · 67% Ask AI
13
30
26
3-pointers made o2.5 2/3 · 67% Ask AI
1
4
3
Pascal Siakam

Pascal Siakam

Indiana Pacers · F · last 4 games
Points o13.5 1/4 · 25% Ask AI
10
13
6
24
Assists o3.5 2/4 · 50% Ask AI
3
4
4
3
Pts + Reb + Ast o19.5 1/4 · 25% Ask AI
15
19
11
31
3-pointers made o1.5 1/4 · 25% Ask AI
0
1
0
5
Aaron Nesmith

Aaron Nesmith

Indiana Pacers · G · last 2 games
Points o13.5 1/2 · 50% Ask AI
19
7
Pts + Reb + Ast o16.5 1/2 · 50% Ask AI
19
13
3-pointers made o2.5 1/2 · 50% Ask AI
4
1

From box scores of each team's recent games. Lines are our reference points, not sportsbook prices.

New Orleans Pelicans vs Indiana Pacers: quick answers

What is the predicted total for New Orleans Pelicans vs Indiana Pacers?
The AI models' mean predicted score is New Orleans Pelicans 119, Indiana Pacers 120: a projected total of 239 points. New Orleans Pelicans games went over 230.5 in 1 of the last 4; Indiana Pacers games went over 230.5 in 3 of the last 4.
What is the AI spread pick for New Orleans Pelicans vs Indiana Pacers?
The consensus has Indiana Pacers winning by 1 points (120–119), from the mean of every model's predicted score.
Who are the key players in New Orleans Pelicans vs Indiana Pacers?
Leading scorers over the last 3 games. New Orleans Pelicans: J. Fears (13.3 pts, 2.5 reb, 3.3 ast), Zion Williamson (10 pts, 2.5 reb, 1 ast). Indiana Pacers: Tyrese Haliburton (16 pts, 2 reb, 5 ast), Pascal Siakam (13.3 pts, 2.3 reb, 3.5 ast).
Is New Orleans Pelicans or Indiana Pacers on a back-to-back?
New Orleans Pelicans have had 5 days of rest; Indiana Pacers have had 5 days of rest.
— Aggregated insights

What’s moving the panel.

01
Consensus favors Indiana Pacers

90% of models lean away — the clearest cluster on this fixture before tip-off.

02
Medium confidence

Mean 60% across the panel with real dispersion — compare unanimous calls vs split tickets in the model table.

03
Expected points tilt 117.30 vs 119.00

Derived from predicted scorelines (model means), not live game data — useful for pace vs vote-share sanity checks.

04
Match context

Rest, recent form and home advantage usually decide whether the favourite wins comfortably or the game stays close; check both teams below.

Ask the Council about this match

Pro

10 AI models vote yes or no with this match's last-5 form, head-to-head, live status and the model picks above attached — not from memory. Then keep asking the same council follow-ups.

Confidence trend

Cumulative average confidence in table order.

First model Last model

Match overview

Looking for a today prediction on New Orleans Pelicans vs Indiana Pacers in NBA? TuringStats aggregates multiple AI scorelines into one readable page so you can see who the models favor, the mean predicted score shown in the hero (119 - 120; the frequency chart below lists the most common exact scorelines), and implied splits before tip-off.

This prediction hub is written for readers comparing betting tips-style language with transparent model votes — not a single black-box call. The headline read is Indiana Pacers win, with vote shares roughly 10% / 90% home and away (rounded).

If you are asking who will win New Orleans Pelicans vs Indiana Pacers, start with the consensus strip and model table, then cross-check form and injuries in Match context further down — that order keeps the strongest signals first.

Explore more

Keep browsing today prediction coverage and league hubs.

Related matches

— Journal

Articles linked to these clubs or AI forecasting.
Ask multiple AIs about this match.

10 models vote yes or no with this match's last-5 form, head-to-head, live status and our model picks attached — not from memory. Then ask follow-ups to the same council.